DSC_0142

Best in Class MFL In-Line Inspection

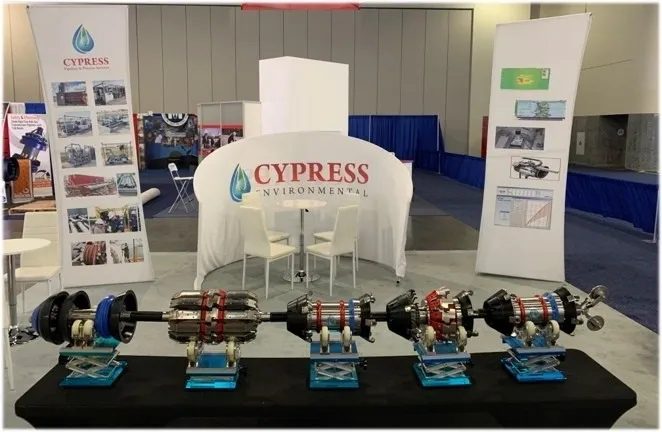
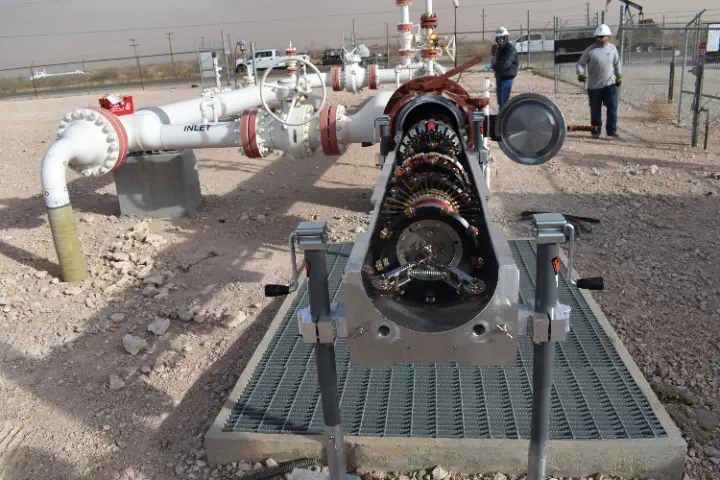
Cypress In-Line Inspection, LLC has taken full advantage of Moore’s Law to deliver the best ultra-high resolution MFL tools for smart pigging conditional assessment. Our team comprises a world-class team of professionals with decades of experience with in-line inspections.

Energy Pipeline Technical Specifications

The tools we offer utilize a proprietary new 1/8” spacing with an overlapping sensor head design. This design doubles the resolution of the industry’s typical ILI MFL tools. Other key advantages include:

Professional Experience

Our team of professionals has decades of experience operating smart pigs for many competitors. Our management team have worked in many parts of the world and we have built a diversified team with highly specialized skills including electrical and mechanical engineering, software development, operations, and data analysis. Cypress ILI undergoes a rigorous professional experience that includes: pipeline feasibility studies, pre-job meetings, kick-off meetings, Job Safety Analysis, field data reports, data quality assessments, project plans, and overall ILI execution excellence.

Providing Quality Tools

Our tools have high-speed processors that allow us to capture 20% more data than typical competitors while running up to 9mph. Our environmentally-friendly batteries have a total runtime of 100 hours between charges.

Data Analysis Services

Once an inspection run is complete, a field technician downloads data directly from the tool’s data modules to a laptop hard drive. The data remains in the tool module’s memory until it is specifically deleted by a user.

This usually occurs after the inspection has been completed and the analysts verify that they have all the pipeline data. The analyst takes raw data from the tool and converts it to a viewable format that interprets the results to complete the analysis.

What We Do With the Data

Converted data looks like a line but is made up of a series of points that record the voltage levels of each sensor at every measurement. Each line is one sensor and all the lines together represent the circumference of the pipe.

When a defect is present, the magnetic field within the pipe wall “leaks” outside of the pipe wall. This results in an increase in strength which in turn creates a higher voltage reading in each sensor.

Ultra-High Resolution MFL ILI

Ultra-High Resolution MFL ILI

Tool System

tear drop
PPIM Image